How AskLibra's 90-Day Analysis Works — And What It Finds in Your Channel
Key Takeaways
- 1
AskLibra's 90-day window captures enough posting cycles to surface real patterns in hook rate, retention, and CTR — without drowning you in noise from your oldest videos.
- 2
The analysis identifies your strongest content formats, best posting windows, and audience drop-off points so you can make targeted fixes rather than guessing.
- 3
Channels that review 90-day data regularly spot format fatigue, seasonal dips, and algorithm shifts before they become subscriber losses.
- 4
Real estate and image-based content formats consistently outperform long-form and Shorts in engagement rate — a pattern the 90-day window surfaces clearly across AskLibra-connected channels.
Why 90 Days Is the Right Diagnostic Window
Most creators either look at their last 7 days in a panic or pull a vague lifetime average that hides everything useful. Neither approach gives you a clear picture. AskLibra's core analysis is built around a 90-day rolling window — roughly 12 weeks of publishing behavior — because that timeframe captures enough repetition to distinguish a genuine pattern from a one-off spike.
Think of it like a doctor reviewing three months of bloodwork rather than a single reading. One abnormal number could be an anomaly. Three months of the same number is a diagnosis. The same logic applies to your channel: a single viral video or a dead week tells you almost nothing. But 90 days of posting data tells you exactly where your content engine is strong and where it is leaking.
If you want a deeper look at what this timeframe can expose, What 90 Days of YouTube Data Actually Reveals About Content Performance breaks down the specific inflection points that only become visible across that stretch.
What AskLibra Actually Measures
When you connect a channel to AskLibra, the platform begins pulling structured data across four core performance dimensions. Here is what each one means in plain language:
1. Click-Through Rate (CTR)
CTR — or Click-Through Rate — is the percentage of people who saw your thumbnail and title in their feed and chose to click. It is the first gate between YouTube's algorithm and your audience. A thumbnail that nobody clicks is a video that nobody watches, regardless of how good the content is. AskLibra maps your CTR across all videos in the window to find which thumbnail styles and title formulas consistently earn clicks versus which ones bleed impressions. For a full breakdown of why this metric controls channel growth, see What is YouTube CTR and why does it control your channel's growth?
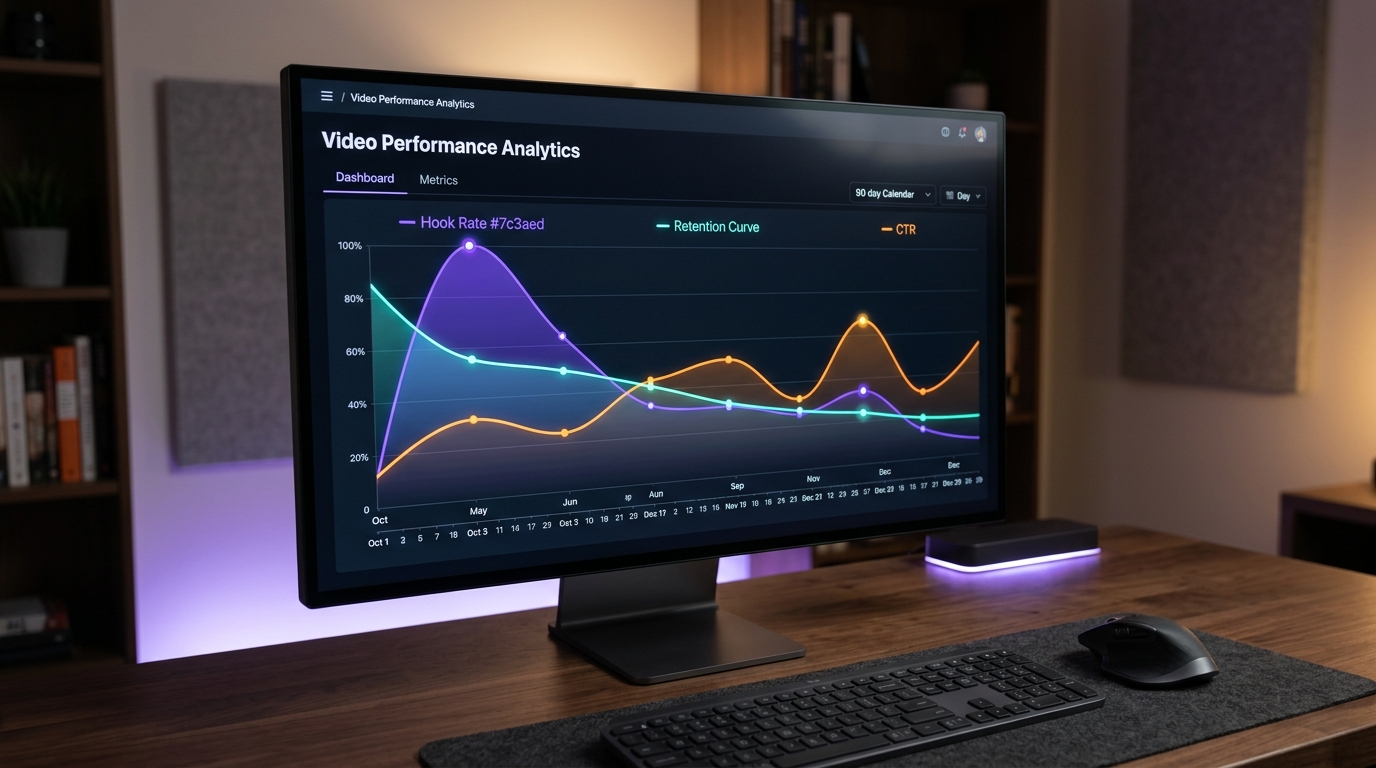
2. Audience Retention and the Retention Curve
Audience retention measures the percentage of a video viewers are still watching at any given second. The retention curve is the visual graph of that drop-off over the full runtime. AskLibra analyzes your average retention curve and flags the specific timestamps where viewers leave — not just the final average percentage. A 45% average retention means nothing if 70% of your audience leaves in the first 30 seconds. That is a hook problem, not a content problem, and the two have completely different fixes. To understand what the numbers on this curve actually indicate, YouTube Audience Retention: What the Numbers Actually Mean is the definitive guide.
3. Hook Rate
Hook rate is a specific metric measuring the percentage of viewers who make it past the critical early window of a video — typically the first 30 seconds. It isolates your intro's ability to hold attention independent of the rest of the video's quality. AskLibra uses hook rate to separate channels with a scripting or pacing problem at the top of their videos from channels with mid-video engagement collapse.
4. Engagement Rate
Engagement rate is the combined volume of likes, comments, shares, and saves relative to total views or impressions. It signals to YouTube's algorithm that viewers are not just watching — they are responding. AskLibra tracks engagement rate by format (long-form, Shorts, image posts, carousels) so you can see which content types generate active participation from your audience versus passive viewing.
Based on AskLibra data from 4 connected channels and 511 videos analyzed, image-based posts carry an average engagement rate of 0.55 and carousel albums reach 0.51, compared to long-form video at 0.02. This gap is not about production quality — it is about format-to-audience fit, and it is exactly the kind of structural insight the 90-day analysis is designed to surface.
The Three Specific Patterns the Analysis Reliably Finds
Pattern 1: Format Fatigue
Format fatigue occurs when a content type that worked well for your audience gradually stops performing — not because the quality dropped, but because the audience has normalized it. The 90-day window shows you the trajectory of each format's engagement rate over time. A slow decline across weeks 4 through 12 is a textbook fatigue signal. Without a rolling window, you would never catch this until your numbers had already collapsed. The "Treatonomics" Movement: How Reward-Based Content Strategy Is Reshaping YouTube Channels explains one proven method for re-engaging audiences who have grown comfortable with your format.
Pattern 2: Optimal Posting Windows
AskLibra cross-references your upload timestamps with your per-video performance data to identify which posting windows correlate with stronger early distribution. Early distribution — the first 24 to 48 hours of a video's life — matters because YouTube's algorithm uses initial engagement velocity to decide how broadly to push a video. If your audience is most active at a time you are not posting, you are handicapping every upload before it has a chance. For a detailed walkthrough on extracting this from your own channel data, see How to Find Your Best Posting Time on YouTube Using Your Own Data.
Pattern 3: Topic Authority Gaps
The 90-day analysis groups your content by topic cluster and measures which clusters produce consistently stronger retention and CTR versus which ones underperform. This reveals whether your channel has topical authority — a tight enough content focus that YouTube recognizes you as a reliable source on a subject and routes your videos to relevant audiences. Channels with scattered topics typically show wide variance in their 90-day performance map. Channels with focused topic clusters show tighter, more predictable performance bands. Topic Clustering and Content Neighborhoods: How to Organize Your YouTube Channel for Algorithmic Authority covers how to act on this finding.
How the Data Feedback Loop Works in Practice
The 90-day analysis is not a one-time report. It functions as a rolling diagnostic that updates as you publish. Here is the practical workflow AskLibra is built around:
Week 1-4: You upload. AskLibra logs CTR, hook rate, retention curve shape, and engagement rate for each video as performance data accumulates.
Week 4-8: Patterns begin to emerge. Which thumbnail style is outperforming? Which video length is retaining more viewers past the midpoint? The platform surfaces these comparisons without requiring you to build spreadsheets.
Week 8-12: You now have enough data to make structural decisions — adjusting your format mix, refining your title formulas, shifting your posting schedule — based on what your specific audience has demonstrated, not on generic best practices from other channels.
This cycle maps directly to the framework described in The 20-30 Video "Data Feedback" Loop: How to Turn Your First Month of Uploads into a Growth Roadmap, which shows how to convert early upload data into a structured publishing strategy.
What Makes 90-Day Analysis Different From Native YouTube Studio
YouTube Studio shows you individual video performance. AskLibra shows you cross-video patterns. The difference matters because no single video teaches you much. It is the relationship between your videos — which titles cluster together in performance, which formats consistently beat others, which posting times correlate with stronger week-one velocity — that contains the actual signal.
Native analytics also do not flag algorithmic sentiment shifts — the moments when viewer emotional response to your content type changes and begins suppressing distribution. Sentiment-Driven Algorithm Shifts: How Viewer Emotion Shapes What YouTube Promotes explains how this layer of the algorithm operates and why cross-video data is the only reliable way to detect it.
For creators who want to get ahead of these shifts rather than react to them after the damage is done, Predictive Social Analytics: How to Use Data to See What Your YouTube Channel Needs Before It Happens outlines the forward-looking layer of AskLibra's analysis.
The Metrics That Actually Move Channels — And the Ones That Don't
One important output of the 90-day analysis is that it forces a separation between signal metrics and vanity metrics. Total views and subscriber counts feel important, but they are lagging indicators — they tell you what already happened. CTR, hook rate, and retention curve shape are leading indicators. They tell you what is about to happen to your distribution if you do not change something. 3 YouTube Metrics That Actually Matter (And 2 That Are Just Vanity) draws this distinction in full detail.
Frequently Asked Questions
Why does AskLibra use 90 days instead of 30 or 12 months?
Thirty days is often too short to separate a single strong or weak video from a genuine pattern, especially for creators posting once or twice a week. Twelve months buries recent algorithmic behavior under old data that no longer reflects how YouTube treats your channel today. Ninety days hits the middle ground — enough posting cycles to find real patterns while staying recent enough to be actionable.
What is hook rate and how is it different from overall retention?
Hook rate measures specifically how many viewers make it through the first 30 seconds of your video, while overall retention is the average percentage watched across the full runtime. A video can have a strong hook rate but collapse at the midpoint, or it can have a slow start that gradually picks up. AskLibra separates these signals so you can diagnose the right problem and apply the right fix.
Do I need a large channel for the 90-day analysis to be useful?
No. The analysis is designed to work with whatever volume of data your channel has produced. Smaller channels with fewer videos will see wider variance in the data, which AskLibra accounts for by flagging low-sample findings separately from high-confidence patterns. Even 15 to 20 videos in a 90-day window can surface meaningful format and posting-time insights.
How often should I review my 90-day analysis?
Monthly reviews are the practical minimum for most creators. The rolling window updates continuously, but checking in every four weeks gives you enough new data to spot emerging trends without over-optimizing based on a single week of performance. Creators publishing three or more times per week can check in every two weeks productively.
Can the 90-day analysis help with short-form content as well as long-form?
Yes, though the key metrics shift. For Shorts, hook rate and completion rate carry more weight than mid-video retention curves. AskLibra tracks both formats within the same 90-day window and surfaces format-specific benchmarks so you are not comparing a 90-second Short against a 15-minute tutorial on the same retention scale.
Ready to see what the data says about your channel?
Stop guessing. Use AskLibra to get a personalized 90-day growth game-plan and find your perfect posting window.
No credit card required • Join 2,000+ creators